

2. Modern Production of Ethanol
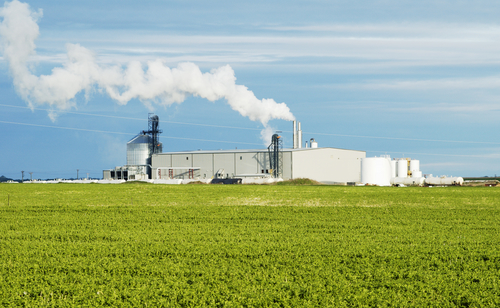
Corn in US
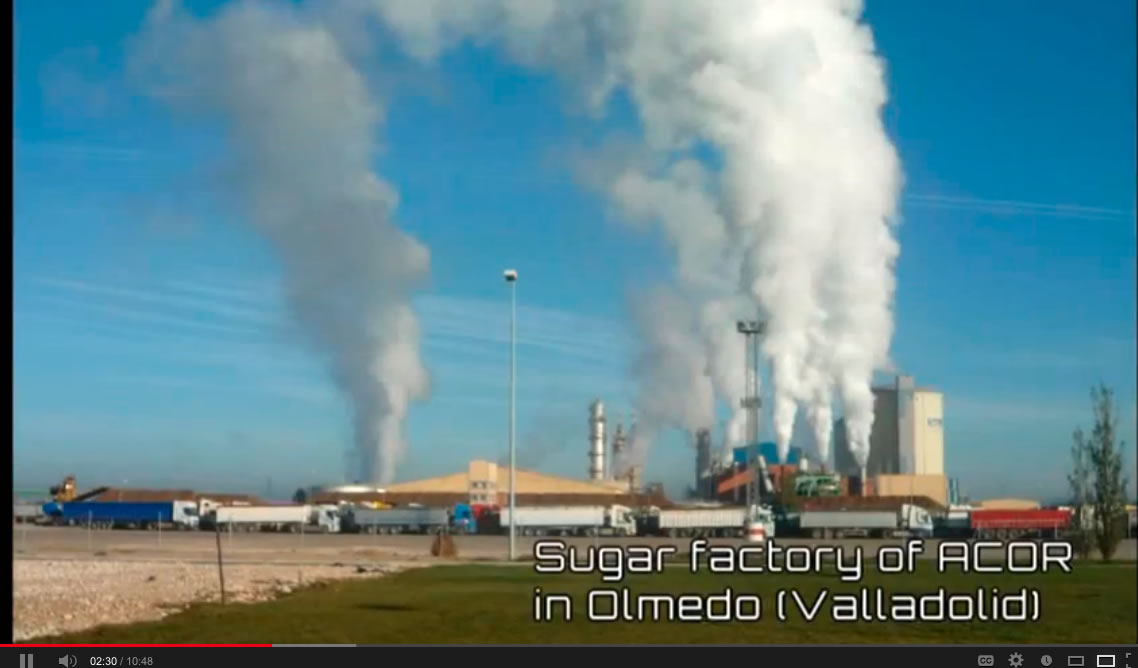
Sugarcane in Peru
Ethanol is produced on a large scale in both the US and Brazil. We will address this specific biofuel, but first let's compare the energy efficiency and well to tank GHG emissions from oil, natural gas, coal and biomass in general.
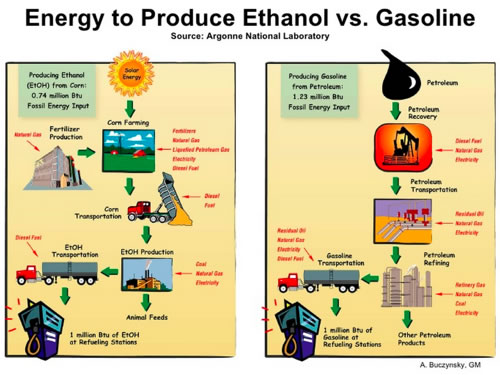
Picturally we see the steps in producing ethanol vs. gasoline.
The table below shows production efficiency, ηwtt, which is defined as the ratio of effectively produced fuel energy and the energy supplied during the fuel production process plus the effectively produced fuel energy. The Well-to-Tank Greenhouse Gases (WTT-GHG) is the amount of CO2 produced during the well to tank process while Feedstock Specific CO2 Credit is the amount of CO2 that the feedstock has consumed during its growth (both these parameters are presented relative to the effectively produced fuel energy: mproduct ⋅ LHV).
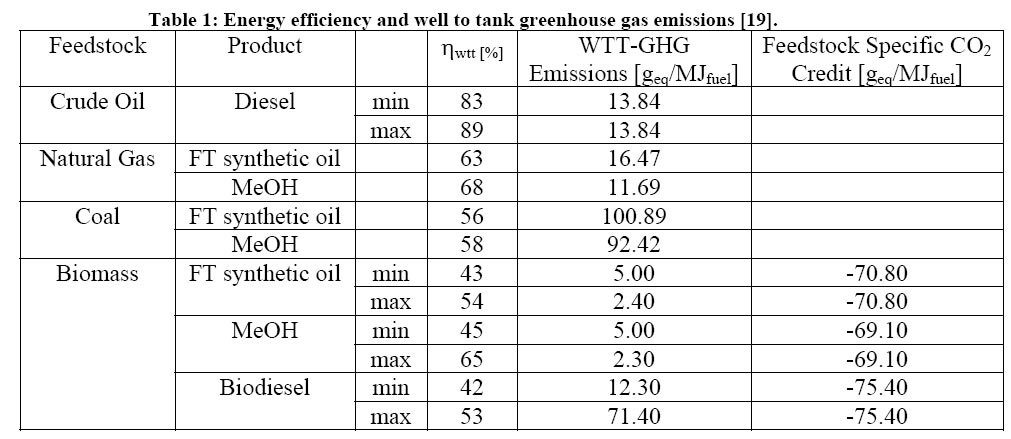
From this table it is clear that methanol from biomass results in significantly lower WTT-GHG Emissions than diesel from crude oil. We will explore ethanol below.
Assuming that biomass based feedstock consume a considerable amount of CO2 during their growth, a feedstock CO2 credit can be defined. This number is independent on the fuel production chain and it is often used as an argument to strengthen the potential of biomass based energy to reduce greenhouse gas emissions from the transport industry. The account of a CO2 credit for biofuels is however a topic under discussion. It appears that biofuels can be a contributor to the fuel pool but are not the solution.
Through technological learning, sugarcane and corn ethanol industries have achieved steady improvements in resource use efficiency and environmental performance. Even greater improvements could be realized in future systems through a combination of continuous technological learning and better utilization of crop residues.
2.1 Ethanol from Corn
In the United States most of the ethanol produced currently is made from corn but other grains can be used. The corn is processed and mixed with yeast that converts the starch into ethanol and carbon dioxide. The ethanol is distilled off and the remaining liquid is centrifuged to remove some water. This residue is called wet distillers grains and usually has 30 to 35% dry matter (DM) and contains most of the fiber, fat, protein, and minerals found in the original grain used to make the ethanol. The liquid removed by centrifuging is usually partially dried and becomes condensed distillers solubles.
Ethanol from corn has si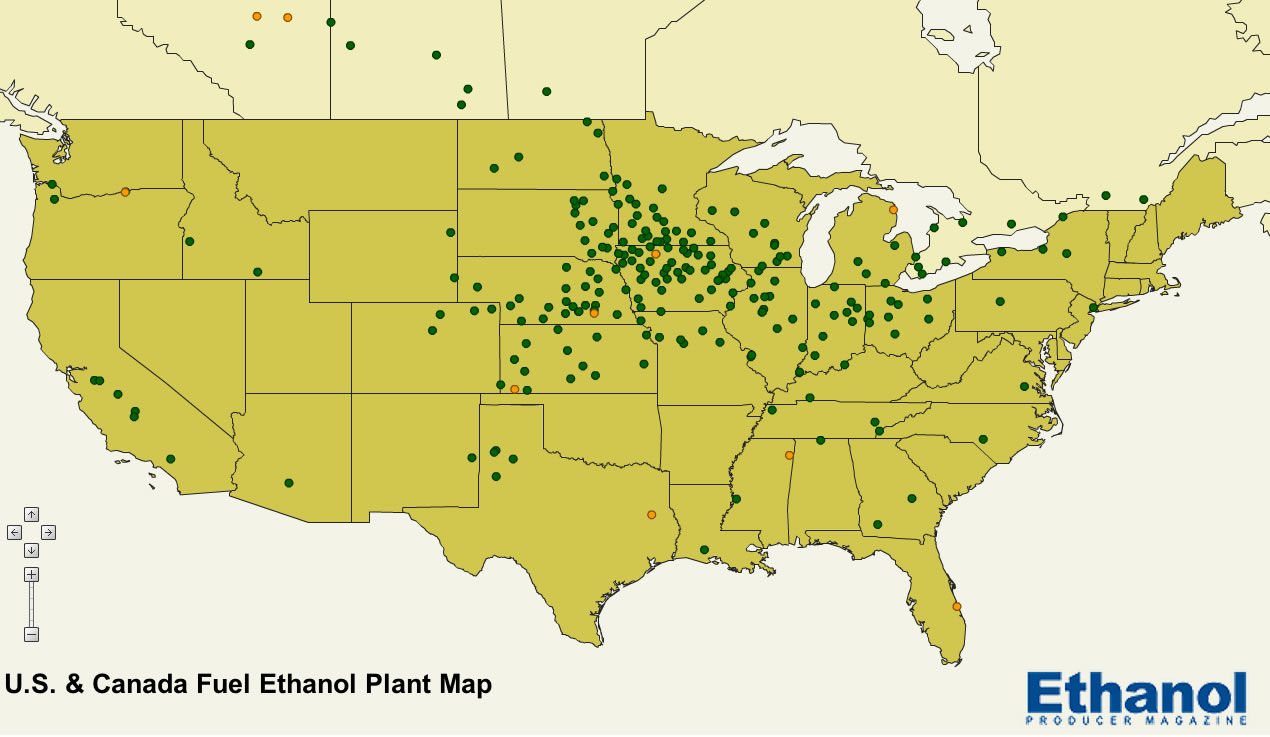 gnificantly improved in the efficiency of production. Ethanol is nowdays energy positive, at nearly 2 to 1, according to Steve Vander Griend. If you take that energy to a volume then we produce 2.8 gallons of ethanol for every gallon gasoline. The map to the left shows the location of ethanol production in the US and Canada.
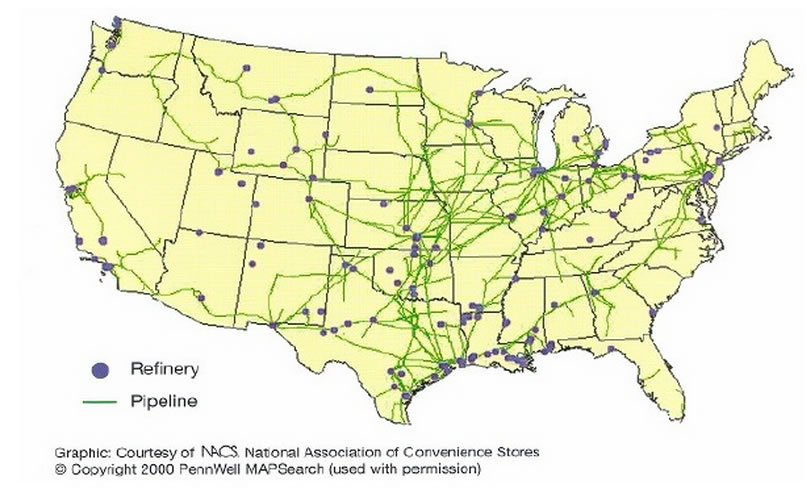
It is of interest to compare the distribution of ethanol refineries with the distribution of oil refineries and, in addition, to see the gasoline and diesel pipeline network spreading out from them. Ethanol production is lacking in the eastern and the southern US, but is otherwise more locally distributed than the oil refineries.
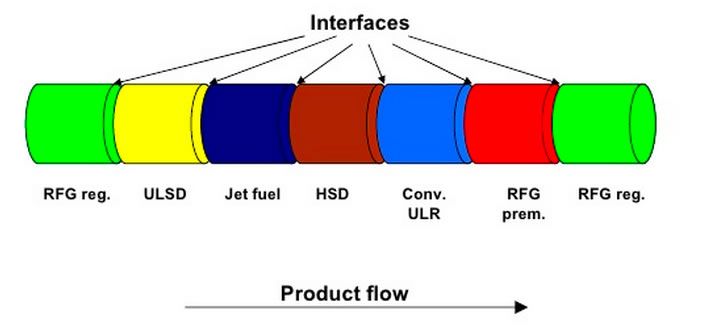 This pipeline distribution system can carry gasoline, diesel and jet fuel. They move through the same pipelines but not at the same time. The system works by pushing 'batches' of the different fuels through the pipe abutting each other. There are of course 'mixing zones' between the batches, that need to be separated again. Use of a "pig" between the zones (at the interfaces) enables separation of the fuels. In addition to their main purpose of separating batches of liquid products in the line, pipeline pigs are plugs that can clean and inspect the integrity of the pipeline. Instrumentation packages allow pigs to test for dimples and imperfections by filming the inside of the pipeline, or pigs with brushes can help scrub pipelines to rid them of product build-up. It can be visualized as above.
Ethanol can't readily be added to this 'fungible' system. The issues are 1) that ethanol is a good solvent, and would pick up the gunk left behind by the petroleum products and be tainted, 2) that ethanol attracts water and thus anhydrous ethanol would be diluted, and 3) that ethanol is corrosive and might damage the pipeline. Actually ethanol is not as much corrosive as it is errosive. It damages the pipeline by gradually wearing it away just like you gradually wear away wood by rubbing it with sandpaper - its an alcohol, not an oil. None of these 'problems' are insurmountable. We discuss ethanol pipelines in Potential of Ethanol.
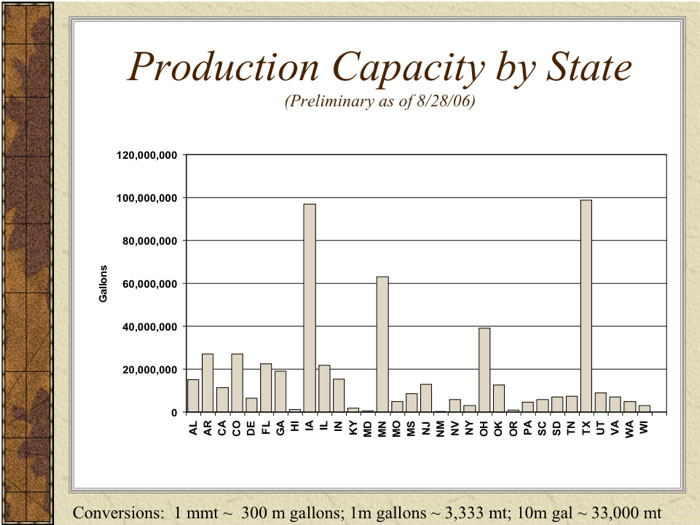
The production capacity of ethanol by state is shown below.
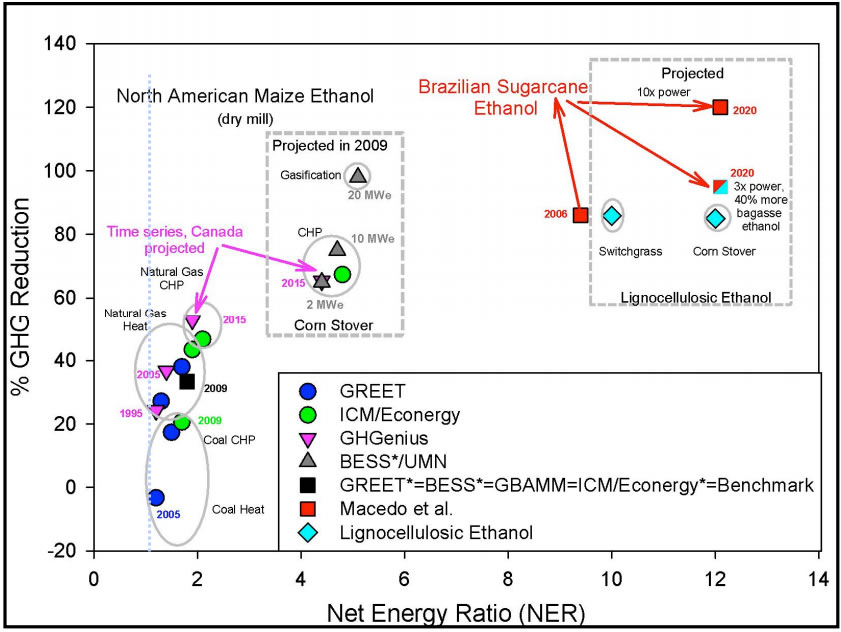
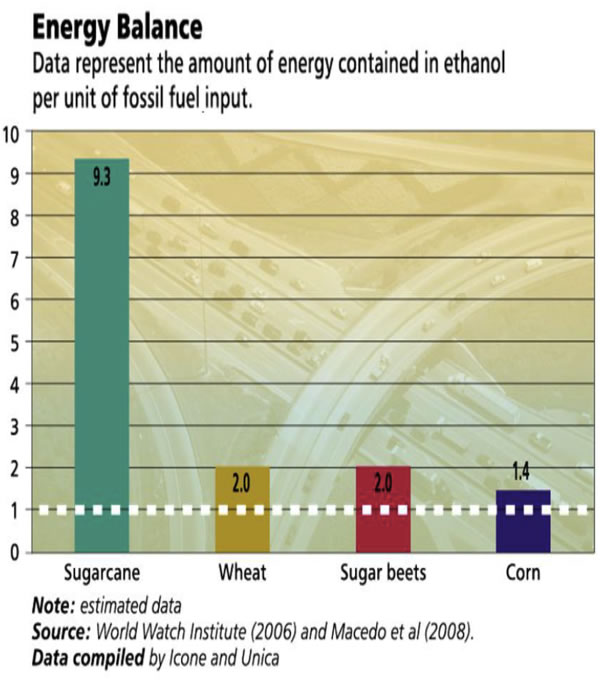
The efficiency of production vs. the CO2 emitted is shown below. An energy balance of 1 is indicated by the blue dotted line. As we can see modern natural gas fired facilities approach a 2:1 Net Energy Efficiency. Future facilities, using combined heat and power (CHP) will achieve NERs of 4 times. It is also of note that Brazilian Sugarcane Ethanol has already achieved NERs of 9 times and are projected to reach NERs of 12. Also evident is that Lignocellulosic ethanol (corn stover ethanol) will have an NER of 12 (see section 2.5 below).
We will discuss the CO2 emission aspects in the section CO2 emissions from ethanol.
2.1.1. The food vs. fuel debate - current first generation ethanol
The story is a bit more even-handed than it looked a few years ago, we explain why below in section 2.8. We will also discuss the Ethanol Limits. There are at least four sides to this story. First is the huge improvement in corn yields, with promise of further improvements. Second,is the fact the only feed corn is used and that after the sugar has been used by the fermentation to create the ethanol, the protein remains and is fed to the cows. Third, is the improvement in making ethanol. And forth, is the improvement in CO2 emissions. We will later suggests newer ways to reduce CO2 further.
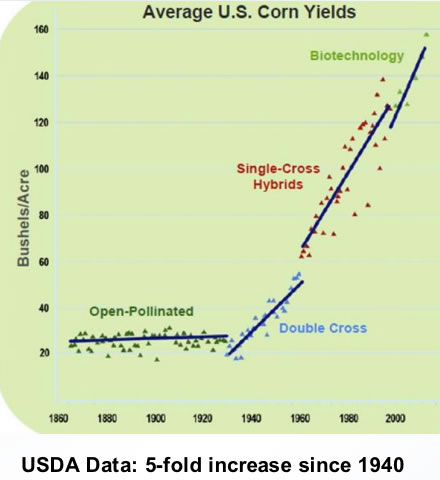
2.1.2. Corn yields have dramatically improved and continue to improve
The graph below shows the improvement in corn yields in the US from 1860 through 2008. Using biotechnology it appears that corn yields will continue to improve. Furthermore, using GPS for accurate planting and harvesting in narrower row plantings will increase yields per acre.
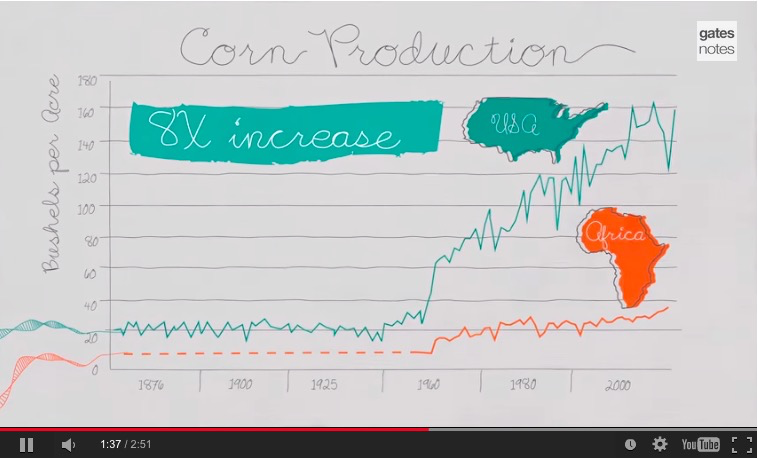
Here is Bill Gates's version, somewhat more entertaining. But showing that the 8x increase achieved in the US has not translated to Africa, where only a 3x increase has been achieved.
The cost of corn production in the US has consequently fallen. The chart below shows the decrease over 30 years from 1975 to 2005. 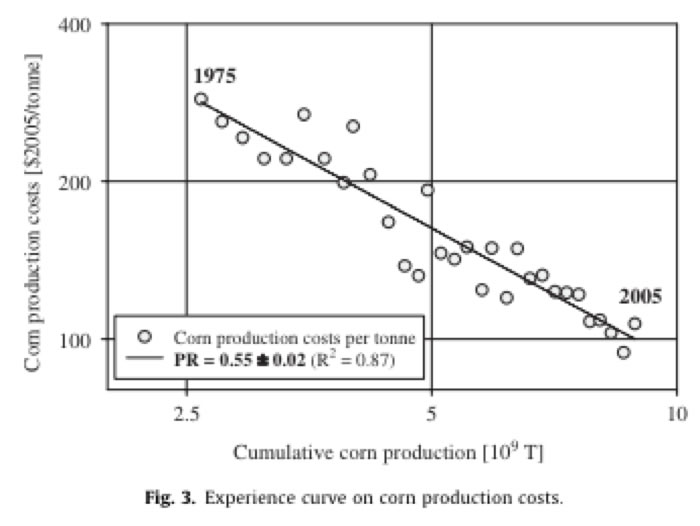
2.1.3. What percentage of the feed corn's food value is lost when ethanol is produced from the corn?
Distillers grains are a byproduct of fuel ethanol production. They have a very long history of being fed to livestock; the first study in the United States about feeding distillers grains to cattle was published in 1907.
In the United States most of the ethanol produced currently is made from corn but other grains can be used. The corn is processed and mixed with yeast that converts the starch into ethanol and carbon dioxide and corn residue. The ethanol is distilled off and the remaining liquid is centrifuged to remove some water. This residue is called wet distillers grains and usually has 30 to 35% dry matter (DM) and contains most of the fiber, fat, protein, and minerals found in the original grain used to make the ethanol. The liquid removed by centrifuging is usually partially dried and becomes condensed distillers solubles. Condensed solubles are a good source of protein, energy, and vitamins but have the consistency of molasses, making feeding difficult. Most distilleries add the condensed solubles back to the wet distillers grains making wet distillers grains with solubles (WDGS). The wet products are either fed as-is or are heat-dried producing dried distillers grains with solubles (DDGS). The nutrient value of the products with and without solubles differs slightly, but only WDGS and DDGS will be discussed further.
The tremendous growth in fuel ethanol production has greatly increased the supply of distillers grains, resulting in increased interest in feeding them to cows and chickens. Distillers grains have very low concentrations of starch because most of the starch in the starting grains was converted to ethanol. Concentrations of protein, fiber, fat, and minerals are increased depending on the concentration of starch in the grain. Corn grain is about two-thirds starch and when most of the starch is removed, concentrations of the other nutrients are increased about three-fold (table 1). Annual production of distillers grains (on a dry basis) was about 1 million tons in 1998, about 10 million tons in 2006, and is estimated to reach 16 million tons by 2010.
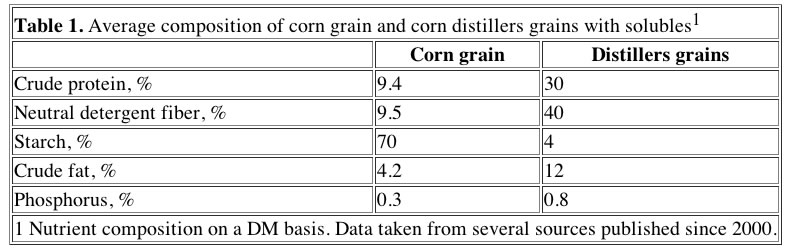
When corn is fermented the conversion rate of corn to distillers grains is: One tonne of corn produces 378 L of ethanol and 479 kg WDG (70% moisture content), or 309 kg of DDGS (10% moisture content).
All types of cattle can efficiently utilize distillers grains when they are part of a balanced diet. Equal or better performance (rates of gain for beef cattle or milk yield in dairy cows) are usually reported when diets with up to 20% of their DM from distillers grains are compared with control diets (usually the distillers grains replace corn grain and soybean meal). When dietary DM is comprised of more than about 30% distillers grains, dry matter (DM) intake, milk yield, and milk protein concentrations are often reduced.
For dairy cattle, the amount of fat in the distillers grains may be the limiting factor for how much can be fed without adversely affecting milk yield or composition. If other sources of supplemental fat are not being fed, fat from distillers grains can make up about 2% of the diet. Therefore, dividing 2 by the percentage of fat in the distillers grains (and multiplying by 100) is an estimate of the maximum amount of distillers grains that should be fed. For example, if distillers grains contained 12% fat, then (2/12) x 100 = 16.7; the diet should contain no more than about 17% of its dry matter (DM) as distillers grains DM.
Since it is usual for the distillers grains to replace corn grain and soybean meal, we can see that about 20% of the cow feed that would be available, from directly feeding the corn and supplementing it with soybean meal protein, is recovered.
2.1.4. Improvements in ethanol production
The key to further improvement in ethanol efficiency is to combine the distillation plant with other needs. For example combined heat and power plants that can use the waste energy to heat buildings. Or, combined ethanol and algae plants, which can provide CO2 and heat to nurture the growth of algae.... more coming.
2.1.4.1. Creating yeast from sugar cane wastes.
The following is from Mathews et al. 2011 (references below).
"With regard to yeast SCP (single-cell protein), the major raw material for its production is molasses derived from sugarcane processing. However yeast SCP need not be produced from molasses alone. Kuhad and Singh(1993) have reviewed SCP production from lignocellulosic wastes as have Daramwal and Gaur(2004). Critically, Silva et al. (2011) have recently described the production of yeast SCP from vinasse, the residue remaining after the distillation of ethanol from the crushed cane. Advances in lignocellulosic fermentation have opened possibilities in the production of high value yeast SCP from what is considered to be waste. We now advocate production of yeast SCP from sugarcane biomass and its use as a feed supplement in the management of open-field livestock, particularly cattle.
The yeast generated from the biorefinery process has a protein content as high as 50% (Reed and Nagodawithana, 1991) making it much superior to other co-products from 1G bioethanol production that have been conventionally employed in cattle feed. Distillers’ dried grains and solubles (DDGSs), pressed beet slices, vinasse and glycerine all have low protein content (Ozdemir et al., 2009) and hence can only be utilized as energy substitutes for grass.
Yeast SCP, however, offers both an energy and protein substitute for grass. In addition to high protein, the yeast biomass contains 31% carbohydrate and lipid (Reed and Nagodawithana, 1991). Hence, a mixed diet in which yeast partially substitutes for grass can match a grass only diet. SCP is readily accessible and can be generated from a variety of raw materials, ranging from petroleum, starch and molasses to whey (Daramwal and Gaur, 2004). Examples include Jerusalem artichoke (Gao et al., 2007), pineapple waste (Nigam, 1999), olive mill waste (Gharsallah, 1993) and waste capsicum powder (Zhao et al., 2010). Our case of SCP derived from sugarcane biomass adds to this list.
We have restricted discussion to open-field livestock, but in considering feed lot applications, there is likely to be a strong synergistic effect whereby yeast is added to feeds that already contain low-protein co-products of 1G bioethanol production (such as DDGS in the US). Yeast with its high protein content can maximize the utility, applicability and general animal nutrition qualities of low-protein feeds. It is yeast that may provide much of the nutritional value of DDGS as it has a favorable amino acid profile (HanandLiu, 2010). Variation in feed ingredients is a leading fact or in reduced quality of feeds and may be corrected by yeast addition. Feed variation also impairs diet fermentability affecting animal health and therefore beef and milk production, which may also be corrected through the probiotic effect of yeast. For example, yeast has been shown to halt the suppression of milk production observed in cattle fed with DDGS (Hippenetal., 2010).
Thus the ‘feed+fuel’ biorefinery is applicable in those countries, which operate feed lots and have the feedstock supplies. This includes Australia (sugarcane as a feedstock), Canada (forestry), New Zealand (forestry) and US (corn), which are all major beef producers. But the most dramatic effect is revealed when we consider the case of Brazil where sugarcane is widely cultivated and extensive ethanol and cattle production exist but have yet to be linked in any serious way. This linkage can be forged via the medium of 2G bioethanol production with yeast SCP as the significant co-product.
In the Brazilian context: "We find then that dry sucrose available for conversion to sugar and ethanol is estimated at 97.2Mt. Of this total just over half, i.e. 51%, is converted to ethanol in a yield of 43% associated with a 3.5% process loss. Thus 21Mt (27GL) of ethanol is produced– which agrees with the 2008 FAO production datum of 27GL for Brazil. But, inaddition, the lignocellulosic pathway generates a total of 145.6Mt of bagasse, trash and tops available for conversion to ethanol and yeast biomass, as a source of SCP. This is the prime benefit of moving to 2G cellulosic ethanol production."
2.1.4.2. Genetically modified energy corn
Biotechnology is beginning to show results. In theory it should be possible to genetically engineer corn (and sugar cane) to produce more ethanol.
One of the first in this category is the corn developed by a branch of the Swiss seed and pesticide firm Syngenta, which contains an added gene for an enzyme (amylase) that speeds the breakdown of starches into ethanol. Ethanol plants normally have to add the enzyme to corn when making ethanol. According to them, "Syngenta (www.enogen.net) has pioneered a truly novel approach to improving dry grind corn ethanol production in a way that can be integrated easily into existing corn ethanol distilling infrastructure. Enogen corn uses modern biotechnology to deliver robust, best in-class alpha amylase enzyme directly in corn grain feedstock. This unique method of delivery provides advantages that are beyond the reach of conventional liquid enzymes.
By dramatically reducing slurry viscosity, Enogen grain facilitates processing of higher dry solids levels. Depending on market conditions, an ethanol plant can then maximize its throughput or yield by speeding up or slowing down its fermentations, thus improving an ethanol plant’s process flexibility, productivity and profitability. In addition to enhanced productivity and process flexibility, Enogen grain can drive significant reductions in maintenance costs, water, electricity and natural gas usage on a per gallon basis."
Enogen was approved for commercial growing by the Department of Agriculture two years ago. On the down side, the food industry is warning of the dangers of contaminating existing corn crops with the new GM corn. The same traits that make the modified corn so attractive to the ethanol industry – the swift breakdown of starches – would be a disaster for the food industry, turning corn chips into shapeless lumps, and stripping the thickening properties from corn starch. Even a small amount of the amylase corn – one kernel out of 10,000 – could damage food products, according to data supplied to the North American Millers' Association by Syngenta. The organisation, like most food industry groups, has opposed the corn, noting failures to prevent cross-contamination from earlier GM breeds. Syngenta’s new corn is, however, approved for food use. Other alpha amylase enzymes are already used in food processing.
Syngenta maintains the corn variety has a high yield, and that it has the appropriate safeguards to prevent cross- pollination. After Kansas, the company plans to expand its growing area to Nebraska, Iowa, South Dakota, and southwest Minnesota. Farmers will grow the corn under contract to an ethanol production plant, getting a premium over regular corn. Buffer rows of corn will be planted. "This is a very slow ramp-up. This is not a broad acre crop at this point," said Paul Minehart, a Syngenta spokesman. Steve McNinch, of Western Plains Energy, in Kansas, the only ethanol plant to have processed the new corn, said adding a small amount of amylase corn to the mix – about 10% – would increase production by 10%.
2.1.5. Improvements in CO2 emissions
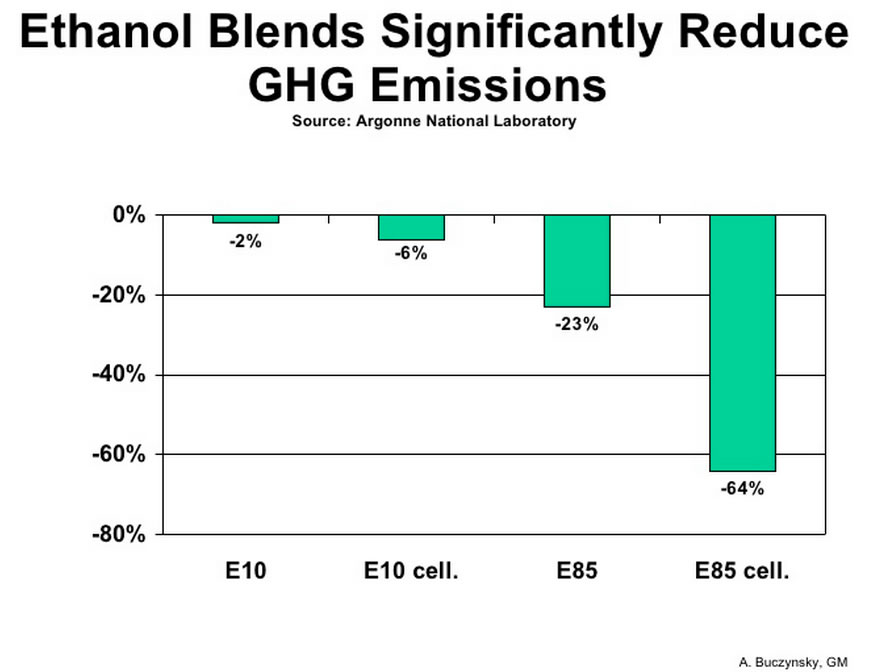 Basically ethanol in use today, E85, reduces GHG by 23%. But the big win is through making cellulosic ethanol as indicated in the chart. It is coming just down the road. We discuss the current situation in the next section and in section 2.6 below. And, we look at the CO2 emissions further here.
2.2. Federal Mandate, Projected Ethanol Production Limits and the 'Blend Wall'
The RFS program was created under the Energy Policy Act (EPAct) of 2005, and established the first renewable fuel volume mandate in the United States. As required under EPAct, the original RFS program (RFS1) required 7.5 billion gallons of renewable- fuel to be blended into gasoline by 2012. Under the Energy Independence and Security Act (EISA) of 2007, the RFS program was expanded in several key ways: EISA expanded the RFS program to include diesel, in addition to gasoline; EISA increased the volume of renewable fuel required to be blended into transportation fuel from 9 billion gallons in 2008 to 36 billion gallons by 2022; EISA established new categories of renewable fuel, and set separate volume requirements for each one. EISA required EPA to apply lifecycle greenhouse gas performance threshold standards to ensure that each category of renewable fuel emits fewer greenhouse gases than the petroleum fuel it replaces. RFS2 lays the foundation for achieving significant reductions of greenhouse gas emissions from the use of renewable fuels, for reducing imported petroleum, and encouraging the development and expansion of our nation's renewable fuels sector.
The graph below shows the 'so called' ethanol cap (yellow bars), i.e., the maximum conventional starch biofuel that is though to be available for fermentating into ethanol. To make more ethanol, so called 'cellulosic' feedstocks must be converted (see below). These are represented by the dark green bar. Other 'advanced biofuels, that are still in development are indicated in light green. Biodiesel is in blue. As of 2012, low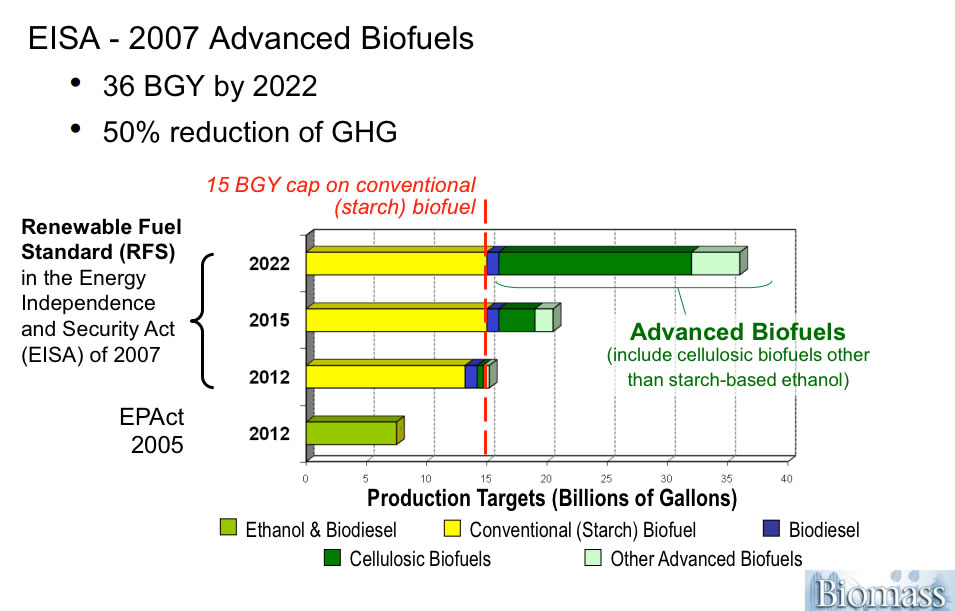 er bar, it is clear that the actual production of ethanol from any of these other 'advanced' methods is currently contributing essentially nothing to the need. The expected output (expected by congress in 2005 and 2007) for the year 2012 is shown in the second bar from the bottom. We clearly have a problem meeting this mandate. As we will point to, making methanol to supplement ethanol is a good solution.
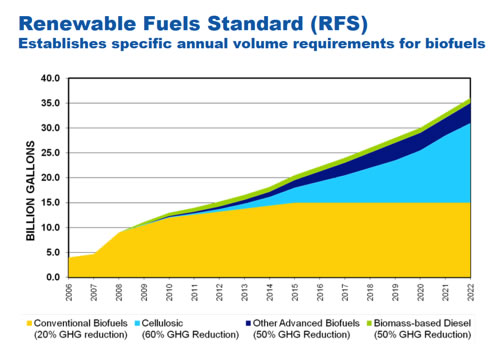
Looked at from a different perspective, other advanced biofuel and biomass diesel will make up a very small fraction of the 36 billion gallons of renewable fuels. Here we also see that corn based ethanol has already ramped up to almost its limit.
Two limits are spoken of. One is the limit due to the maximum amount of feed corn we can grow, and the second is termed the "blend wall". The maximum amount of feed corn will, of course, depend on the growth of corn yields (pictured above to still be growing very fast). However, for planning purposes, it has been projected by the US government to be approximately 15 billion gallons per year (red dashed line at the end of the yellow bars in the figure above, or the orange wedge in the figure just below). The 'blend wall" is a term used to describe the amount of ethanol that can be used under current operating conditions. By this we mean that since the number of vehicles in the US is relatively stagnant, at ~ 250,000,000 (we put 12-15 million on the road each year, but many of these are replacements for junked older cars), and the number of E85 vehicles is only 11,000,000 most of which are using E10 for many of the reasons discussed in the Value of Ethanol in ICE Section, and the Refineries Section. Thus, E10 is responsible for the majority of ethanol sold, and because most stations dispense it already, there is no way for ethanol usage to grow domestically beyond the current 12.5 million gallons/year. Producers are already exporting ethanol.
2.3. Video overview of ethanol issues can be found on our page Videos and Slideshows: here.
2.4. World-Wide ethanol production and costs
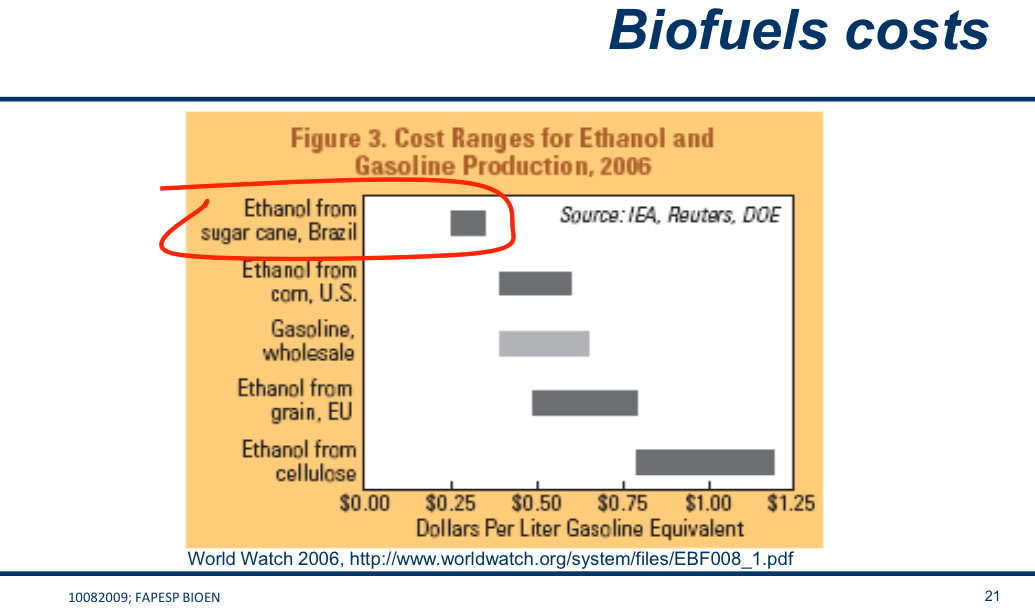
The map below, from Szklo et al. 2007 shows the cost and volumes of ethanol produced in 2006. Of course the US ethanol production has increased immensely since 2007, but it is interesting to see that of the 5 regions that are actively producing Brazil and China have the lowest cost ethanol, and the EU has the most expensive.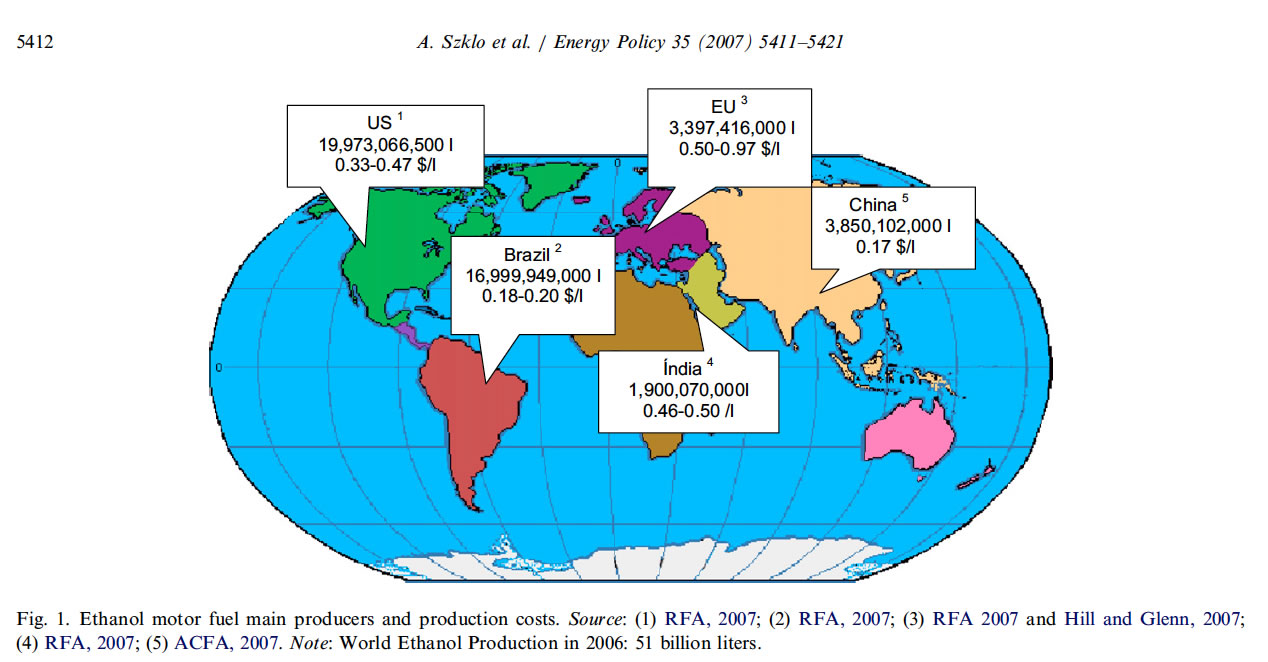
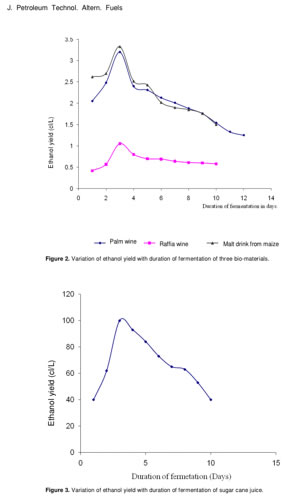 The reason ethanol from different feedstocks costs different amounts is a complicated set of factors which, of course, includes labor costs, water and land costs, fertilizer costs, fuel costs, etc. However, the efficiency of the distillation process is also a major factor. In the chart to the left we see that corn is much less efficiently distilled than sugarcane. The top chart compares malt from corn (maize) and palm wine, which are similar in ethanol yield, with both peaking at about 3.4 cl/liter. The bottom chart shows sugarcane juice, which peaks at about 100 cl/liter. Thus, we see that we obtain about 29 times the peak yield from sugarcane than we do from corn.
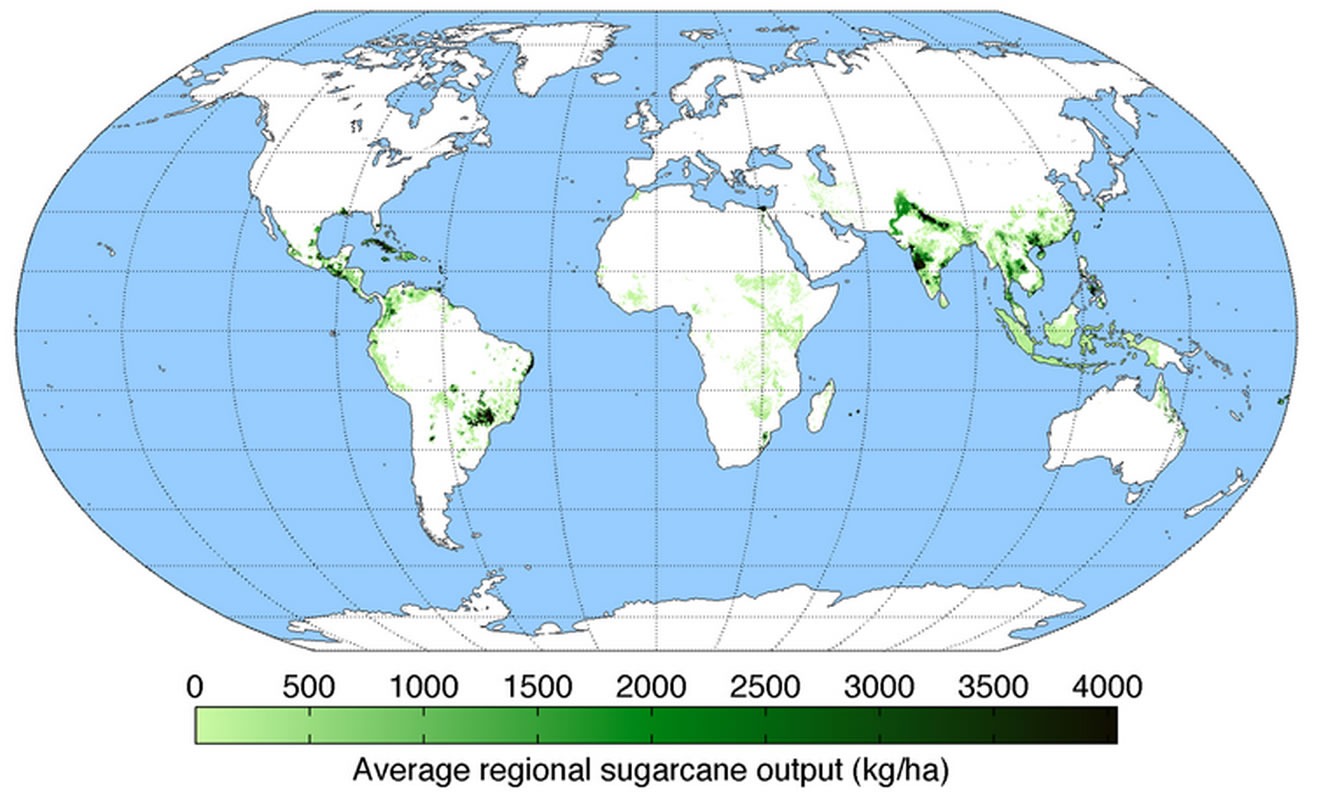
2.5. Ethanol from Sugar Cane
 As can be seen in the map below, many of the ethanol producing countries are using sugarcane as the plant resource. Sugarcane is an ideal crop for tropical countries to grow, because of its high biomass production. Sugarcane is generally grown in regions with high rainfall and so irrigation is not required. Sugarcane is a perennial, and so does not need to be planted each year. After maturing for 12 to 18 months, it can be harvested each year for between five to seven years, with a consistent yield. Sugarcane is, therefore, a favored feedstock for ethanol production due to the ease of its production and its reduced GHG emissions balance when compared to other feed-stock candidates (Goldemberg et al., 2008).
The table below left, lists the 10 top producers uisng sugarcane.
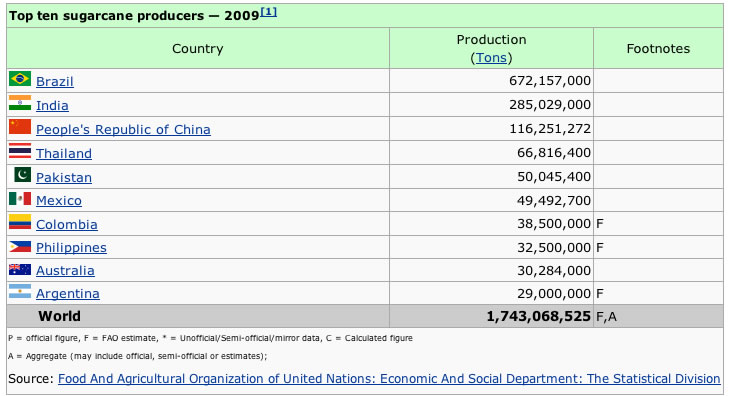
Sugarcane is a major crop in many countries. It is one of the plants with the highest bioconversion efficiency. Sugarcane crop is able to efficiently fix solar energy, yielding some 55 tonnes of dry matter per hectare of land annually. After harvest, the crop produces sugar juice and bagasse, the fibrous dry matter. This dry matter is biomass with potential as fuel for energy production.
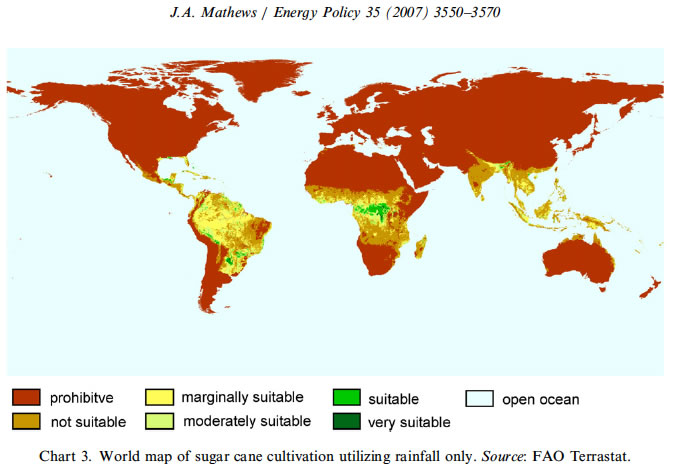
What about water? Sugar cane can be grown from rainfall alone, as verified by the FAO of the United Nations. The world map for rainfed sugar cane cultivation conditions (using very conservative assumptions) provided by FAO is reproduced in Chart 3. Note how the designated areas follow the tropical countries fed by monsoon rains.
2.5.1 Brazilian Ethanol Production
Brazil is the largest ethanol producer from sugarcane. It has evolved the most efficient way to make it, and is very competitive. Brazil currently produces nearly 20 billion liters of ethanol in a year from just over 2 million hectares of land—a yield of nearly 10,000 liters per hectare. Brazilian ethanol is more competitive than that produced in the US from corn or in Europe from sugar beet, because of longer processing times (the starch has to be rendered into sugars first), higher labor costs, higher transport costs and input costs in both Europe and the US. 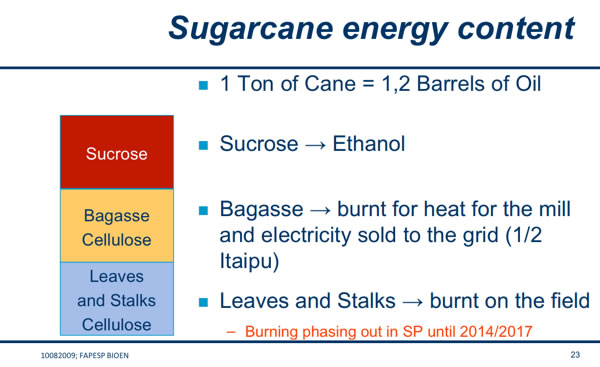
Roughly 1/3 of the biomass of sugarcane is convertible to ethanol. Another 1/3 -- the bagasse -- the remains of the stalks after the sucrose is squeezed out is used for heat for the mill. The remainder, leaves and stalks are often burnt on the fields.
The energy balance comparison with other ethanol feedstocks, particularly corn, is striking.
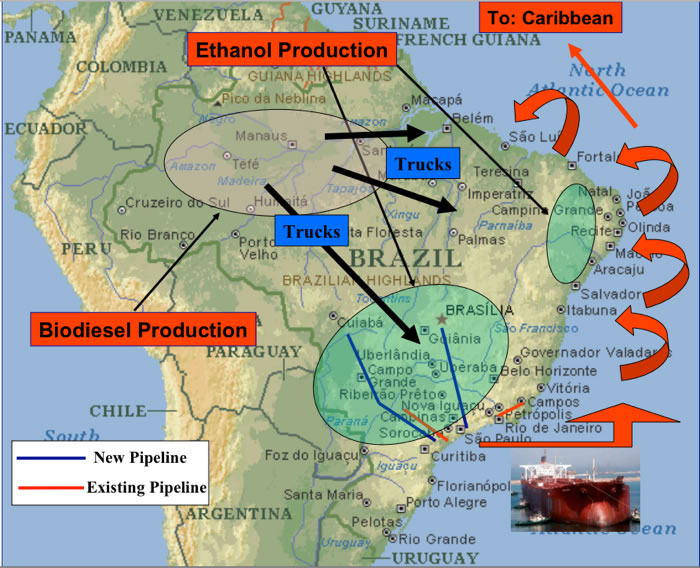
The map below shows the ethanol producing regions and the biodiesel production region (in the Amazon basin). In the large green oval, the region where sugarcane is predominant and growing, we can see two blue lines representing new ethanol pipelines that will be an important transportation and distribution mechanism moving ethanol to seaports around Sao Paulo. In the US ethanol distribution could also be significantly helped by building pipelines to move ethanol both eastward and westward.
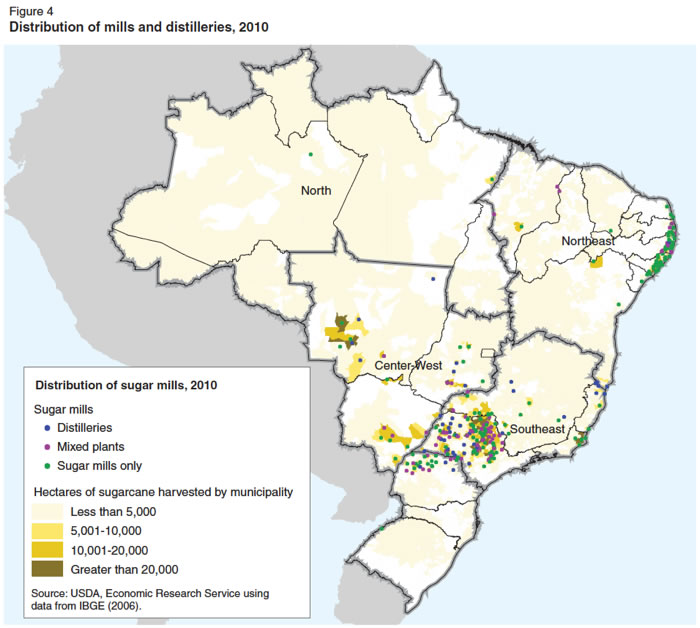
The map below shows details of the largest sugarcane producing regions in Brazil.
Fertilizers are a feature of Northern agri-industrial practice, but they are not essential to Brazilian sugar cane production. In Brazil, the waste products of ethanol production, termed vinasse, are rich in organics, and can be returned to the cane fields which are always close to the mill. The cane plant is used to the full, and what is left after crushing (bagasse) is fed into boilers to provide electric power for the bioreactor, and even for exporting power to the grid (where regulations allow this). So fertilizers are needed but not on anything like the scale used in the North.
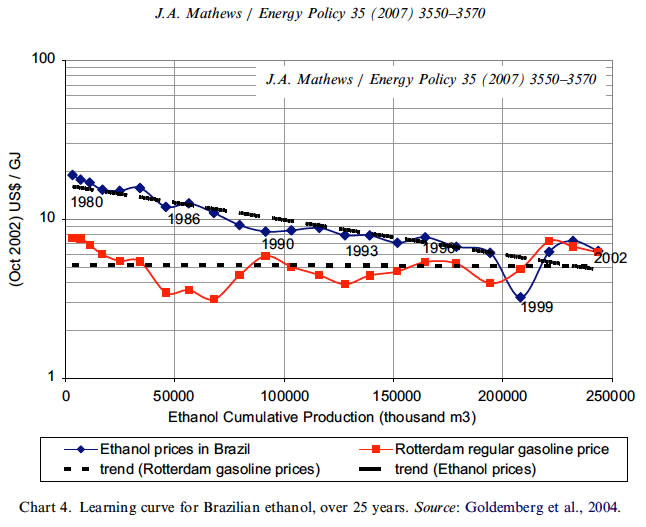
In Brazil, a vast R&D effort over 25 years has been poured into improving cane varieties, through breeding and through genetic engineering, to produce high-yielding varieties that are pest resistant. The genome of sugar cane Saccharum officinarum has been decoded, and used to select varieties that are more resistant to drought and pests and that yield higher sugar content. The Brazilian Cane Technology Centre has developed some 140 varieties of sugar, which has helped to drive costs down by 1 percent a year, as shown in Chart 4 (below the tables).
So pesticide use has been reduced to a minimum, while herbicide use has been eliminated through harvesting the total cane, with or without any weeds that grow as well. So pesticides and herbicides do not present a significant problem, and few run-off problems are encountered in Brazil where these matters are dealt with responsibly.
The map above showing the correspondence of rain feed sugarcane and Brazil also suggests that much of Brazilian sugar cane does not have to be watered. 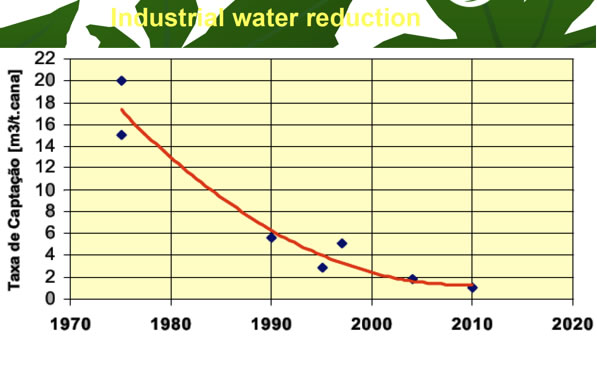 The chart on Industrial Water Reduction shows the great strides made to reduce water usage over 3 1/2 decades.
The table below shows the production from 2008 to 2013. The variation reflects the bounty of the individual year's harvest as well as gasoline prices.
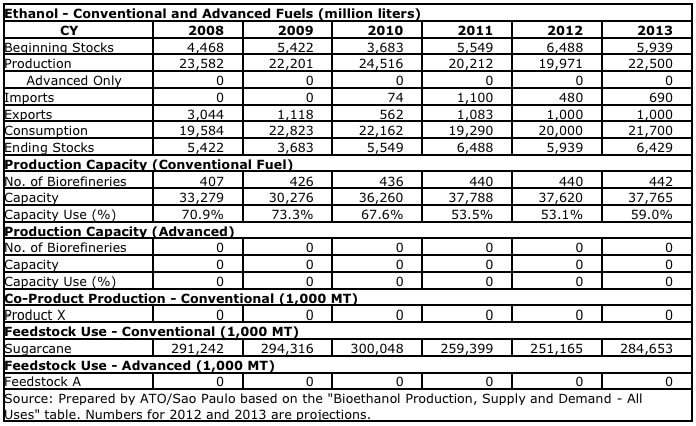
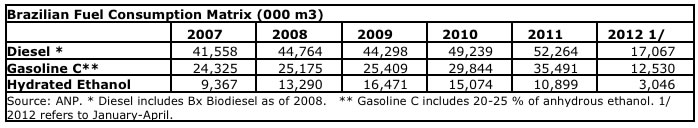
The chart below indicates the percentage of ethanol both hydrous and anhydrous relative to gasoline used. Although it is clear that the combination of both gasoline C and Hydrated Ethanol make up about 47% of the fuel used in 2011, it varies from year to year.
Over 73 percent of total ethanol produced in Brazil is hydrous ethanol, and 27 percent is anhydrous ethanol. Since the introduction of flex-fuel vehicles in 2003, production of hydrous ethanol has increased about 25 percent annually, while production of anhydrous ethanol to blend with gasoline has declined 1 percent annually.
Ethanol yields have more than doubled since the early 1970s, rising from 40 to about 100 liters of ethanol per ton of cane. Millers have increased industrial efficiency by introducing new cane grinding systems, improving distillation processes, and reducing the ethanol processing time. Between 2000 and 2007, ethanol yields from sugar increased by 45 percent (CONAB, 2008). Innovations in industrial processes include the use of byproducts, such as cane molasses to produce ethanol and bagasse to generate heat and electricity. Molasses use for producing ethanol increased 9 percent annually in 2000-2009, and the use of bagasse grew 8 percent per year in the same period, which reflects processors’ increasing use of cane byproducts for ethanol production
As the graph below shows the cost of producing ethanol from sugar cane in Brazil has come down, over the period from 1980 to 2002, to the mean value of regular gasoline (Rotterdam price). The decrease from $17/GJ to $5/GJ is a dramatic example of the engineering practice at work. This is important to keep in mind when we examine the situation for cellulosic ethanol, below.
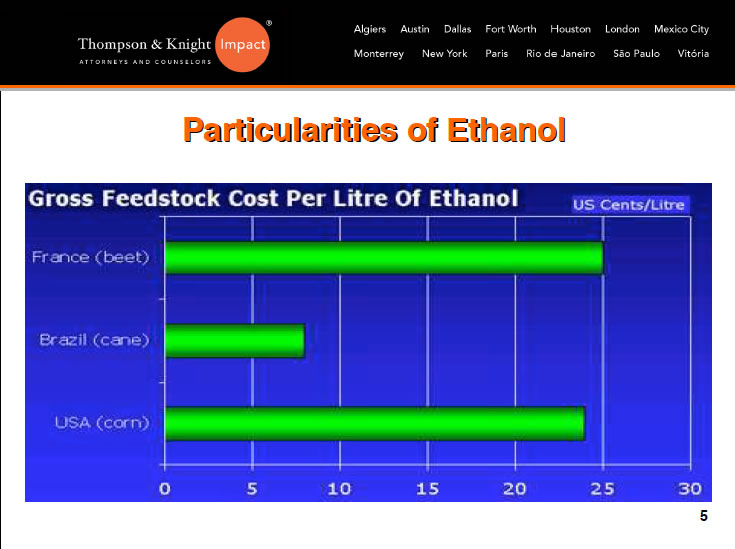
Looked at from a feedstock cost perspective, the chart below shows that Brazilian ethanol has a distinct advantage on the world market over French beet ethanol and US corn ethanol.
Overall Brazilian ethanol enjoys a significant cost advantage over US corn ethanol, gasoline, EU grain ethanol and cellulosic ethanol (2006 price comparison below). After reading the story below, you are encouraged to think about the value modern sugarcane based ethanol production would provide if it were to be introduced into Hawaii, Florida, Cuba or other tropical regions.
2.5.1.1. The fertilizer story for sugarcane.
Again taking from Mathews et al. 2011, a favorable nitrogen balance is put in place with sugarcane. Normally it is assumed that a substitution of grass pasture with sugarcane would result in increased GHG emissions because of the use of nitrogen fertilizer. However in some areas of Brazil sugarcane has been grown for 100 years without the application of nitrogen fertilizer (Dong et al., 1994). Breeding of sugarcane has been traditionally under low nitrogen inputs so that the response of varieties to fertilizer is weak or null (Boddey et al., 1991). The sugarcane plant has been found to assimilate more nitrogen than the low amount applied (Reis and Kennedy, 2007) providing evidence of biological nitrogen fixation by sugarcane, which has been proved by subsequent studies as reviewed by Herridge et al. (2008). Despite the removal of nitrogen by traditional burning of sugarcane prior to harvest the soil levels of nitrogen have remained constant. This suggests that removal of 70% of the trash, with 30% remaining as a blanket, may not prove deleterious to soil health. If trash is removed and processed, as proposed in the Mathews et al. paper (discussed above), the nitrogen is converted to yeast biomass or remains in vinasse, which is then applied to the field.
2.5.1.2. Secondary GHG emission and specifically CO2 emissions
Mathews et al. 2011 continue making the argument that "three factors that may cause changes to the overall GHG emissions are worth discussing, including that caused by converting pasture land for sugarcane plantation, the change to methane emissions of cattle using yeast as a feed supplement, and possible increase in electricity usage by utilizing bagasse as biofuel feedstock instead of energy source of sugar and ethanol facilities in the current practice.
On a qualitative basis, we find that there is no substantial penalty in GHG emissions associated with the land change from grassland to sugarcane when carbon and nitrogen balances are compared. On converting grassland to sugarcane the ground would initially be tilled and then once every five to seven years of the sugarcane crop cycle. This represents more intensive management than that required for grassland and would result in higher emission of carbon. It is well documented that there are large soil organic carbon (SOC) losses on such intensive tilling for temperate regions: estimated at 42–59% by Guo and Gifford (2002). However, the same may not apply to Brazilian soils (Maia et al., 2010). Here a SOC loss of only 10% has been observed (Zinn et al., 2005). Furthermore there are results showing no changes or even increases in SOC (Maia et al., 2010) on conversion of native vegetation in Brazil.
Currently little cane trash is recovered from the field, even though schedules for phasing out trash burning practices is underway (Macedo et al., 2008). Under our scenario, bagasse is used as a feedstock of the biorefinery; therefore, electricity consumption in the mills may rise, even though the lignin from the residual bagasses will still be available to be burnt for process energy. However, that does not seem to have a significantly negative effect on the overall GHG emissions of Brazil, for several reasons.
Let's consider the CO2 changes resulting from not generating electricity from bagasse. First, hydropower is the dominant source of electricity generation in Brazil, accounting for about 85% of the total electricity generation in 2009 compared with 8% from thermal power stations in the same year. Therefore, electricity of Brazil is relatively ‘clean’ in terms of GHG emissions. Second, by converting bagasse to ethanol, we believe that bagasse is more efficiently used as an energy source, thus possibly contributing to reduction of GHG emissions. According to an estimate of Wang et al. (2008), which is used as an input parameter in the GREET model developed by the Argonne National Laboratory of the US, bagasse combustion in sugar and ethanol facilities in Brazil supplies 1188 MJ of thermal energy per Mt of sugarcane in biomass boilers to produce steam with an efficiency of 80%. Our analysis indicates that the 929 Mt of sugarcane from 11.6 Mh of land now can produce 64.6 GL of additional ethanol (see above). According to the Transportation Energy Data Book (2010) of the Oak Ridge National Laboratory of the US, the energy content for ethanol is considered 84,600 Btu per gallon, or 23.6 MJ per liter of ethanol. Therefore, the 64.6 GL of additional ethanol would have 1,524,560 MJ of energy output, compared with 882,921 MJ of thermal energy that would have been produced by bagasse of 929 Mt of sugarcane in sugar and ethanol mills. Third, the use of waste (bagasse, trash and tops) as biorefinery feedstock will be very likely to reduce sugarcane field burning, which is estimated to account for about 24% of the total GHG emissions in association with sugarcane ethanol production (Wang et al., 2008).
2.5.1.3. Sugarcane bagasse
Sugarcane bagasse is a potentially abundant source of energy for large producers of sugarcane, such as Brazil, India and China. According to one report, with use of latest technologies, bagasse produced annually in Brazil has the potential of meeting 20 percent of Brazil’s energy consumption by 2020. Today, bagasse is often discarded or burned in power plants, but more energy and value could be derived by converting it into advanced biofuel and biogas. “In Brazil there’s plenty of sugarcane and Cetrel chose it as a main subject for a thorough investigation. As a result, we have today(2009) a complete understanding of its characteristics and how it reacts, enabling us to extract the most value out of the sugarcane,” says Nei Silva. Using Cetrel’s know-how in waste-stream treatment and Novozymes’ biotech expertise, the partners aim to enable sugar and ethanol production plants in Brazil to turn bagasse, the waste from sugarcane production, into biogas using enzymes. The biogas can be used to produce electricity for the production facilities, and surplus electricity can be sold to the market through the electric grid.The partnership is still in an early development stage but if successful, the technology might be commercially viable a few years from now.
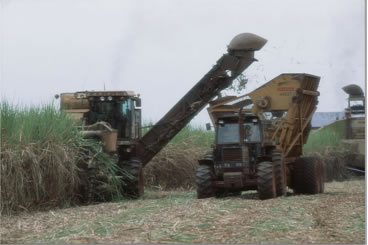
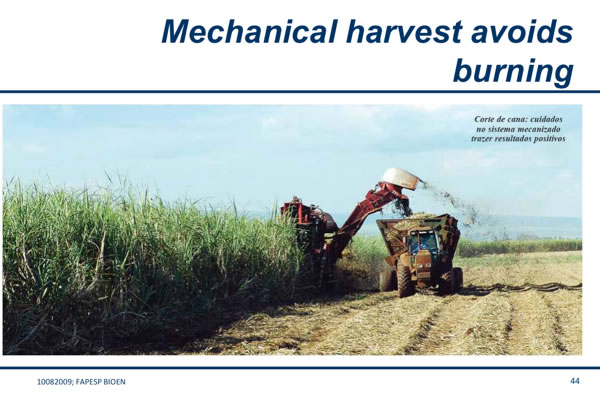
2.5.1.4. Mechanized cane harvesting
Mechanical harvesting of sugarcane is increasing rapidly. An important aspect of the mechanization is that the sugarcane fields do not need to be burned. This greatly reduces pollution and eliminates the need for labor. In countries where labor is expensive, like the US, mechanization can enable sugarcane to approach the Brazilian cost model.
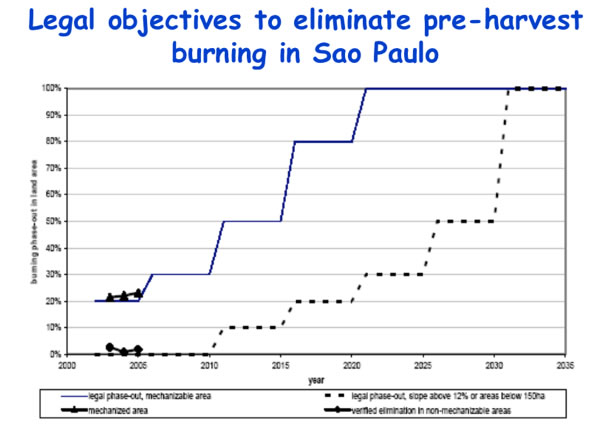
As the timetable below indicates, in Sao Paulo Brazil cane field burning is going to be phased out as mechanization takes over human labor. The elimination of burning depends on the gradation of the land the cane is grown on.
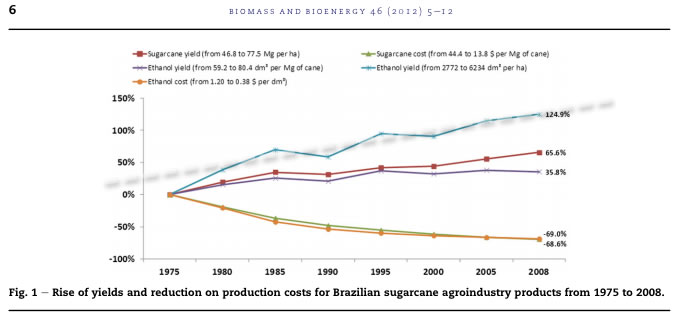
2.5.1.5. Overall Brazilian ethanol efficiency improvements
The very significant improvement in production costs over the last three decades is shown below. Note the linear increase in ethanol yield over this period.
2.5.2. Indian Ethanol from sugarcane
India is the second largest producer of sugarcane in the world with 280 MTPA. It stands fourth in the world in ethanol production at about 1.3 billion liters per annum. The installed capacity is about 2.7 billion liters PA in 278 distilleries.
2.5.3. Comparing US Corn and Brazilian Sugarcane Ethanol Outputs
In 2004 corn in the US produced 4829 l/ha and sugarcane in Brazil produced just under 7000 l/ha thus sugarcane produced 7000/4829 = 1.45 as much ethanol. There is also an important difference in water and fertilizer as well. But 2012 the yields changed to 9000 l/ha for sugarcane and 6449 for corn or 9000/6449 =1.40. Thus, corn has gained a little, very little on sugarcane -- the ratios are essentially the same!
2.6. Cellulosic Ethanol
2013 looks to be the year of the first significant commissioning of cellulosic ethanol plants. The amounts to be made will still be tiny compared to the Federal Mandate for 2013. Still the effort focused on developing ethanol as a transportation fuel focuses almost exclusively on cellulosic ethanol. Almost anything with starch can be fermented. That makes cardboard, wastepaper, sawdust, weeds and plant waste all potential sources of ethanol. There’s a catch, of course: the complex starches these materials contain are harder to extract and ferment than the simple sugars in food. Cellulosic ethanol is made from complex starches contained in the cell walls of hard, stalky (and mostly inedible) plants like switchgrass, as well as in plant parts like corn stalks. These cell walls contain cellulose – a polysaccharide with several hundred to tens of thousands of linked glucose molecules–and hemicellulose, a starch composed of many different types of simple sugars linked together.
Before cellulosic molecules can be fermented, they must be separated from the lignin and pectin holding the plant wall together. Once the binders are gone, challenges remain. The structure of cellulose makes it hard to break down into simpler sugars. Hemicellulose is easier to break down, but the sugars into which it decomposes are harder to ferment completely. The range of treatments being explored to make this conversion feasible and , but right now, it is still very difficult to produce cellulosic ethanol in an economically and energetically efficient way. Yes, in the future, cars may run on fuel generated from stuff we would otherwise throw away, but we are far from being there yet, and there are serious concerns about the viability of scaling up the production process in an economically efficient way.
The top ten companies in the cellulosic ethanol field as of Spring 2013 are shown in the table below, along with their feedstocks, bio-pathways, ethanol capacity and locations.
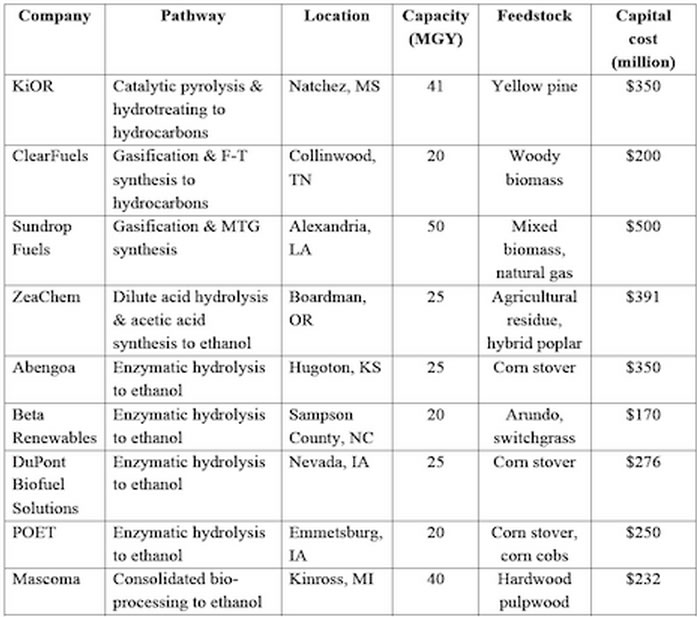
On schedule to be one of the first commercial plants, the Liberty plant of POET-DSM Advanced Biofuels' is scheduled to start up in early 2014, POET-DSM executives said at the Fuel Ethanol Workshop (FEW) Tuesday June 11 in St. Louis, MO. POET-DSM's Project LIBERTY will use bales of corn cobs, leaves, husks and some stalk to produce 20 million gallons of cellulosic bio-ethanol annually, later ramping up to 25 million gallons. The plant is under construction in Emmetsburg, Iowa.
- See more at: http://www.emmetsburgnews.com/page/content.detail/id/521705/Project-LIBERTY-Construction-On-Target.html?nav=5001#sthash.qwuN44n8.dpuf2.6.1. Ethanol production in the new industrial ecology
Although electricity production is a way to use bagasse, we go back to the even more enhanced value of producing yeast single cell protein (SCP). Our result provides a way of demonstrating that imaginative and innovative linkage between value chains can have profound repercussions and transform traditional thinking. Linkage between value chains is a central concept in the new discipline of industrial ecology, and our demonstration of its possibilities in linking bioethanol with cattle production through the medium of yeast co-product would be a prime case of such industrial ecological linkage (Socolow et al., 1994). We would expect it to be followed up with similar cases, in China, India and other emergent industrial powers. Biofuels, if produced by second generation (2G) methods in a country such as Brazil with abundant biomass resources, and in a way that utilizes only land released from existing pastoral production, can thus be produced with minimal indirect land use carbon (ILUC) effects. Moreover, by generating yeast SCP to be used in cattle feed, the value chains associated with biofuels and cattle raising can be linked, resulting in expanded sugarcane cultivation for increased ethanol and food production. This is a promising way forward for a world where resources are coming under increasing pressure.
2.7. Ethanol From Natural Gas
The Texas-based Celanese has created a new ethanol technology called TCX to create ethanol from local hydrocarbons, such as abundantly available natural gas. This ethanol is price advantaged, chemically identical to corn-derived ethanol and can be used for industrial applications (to create products such as paints, coatings, inks and pharmaceuticals) or as a fuel.
The background here? Celanese is the long-time leader in the manufacture of acetic acid, which is a two-carbon cousin to ethanol and is also the primary component of vinegar. About five years ago, the company developed a list of 26 chemically possible additional products it could produce using its basic intellectual property, and eventually whittled that down to industrial ethanol and fuel ethanol.
The path to methanol from natural gas has been around for a long time – ethanol is something of a breakthrough in terms of the costs they can produce it at. Essentially, the Celanese breakthrough has been to develop a highly selective chemical reaction that produces lots of ethanol, and a lot less byproduct than other reactions developed elsewhere in the past. They produce ethanol from methanol and syngas, which suggests that they will generally be co-located with a gasification facility.
At scale, Celanese can produce ethanol from natural gas at parity with $60 oil, or around $1.50 to $1.75 per gallon – substantially advantaged over corn ethanol while corn remains at $7-$8 per bushel.
Subsequently, Celanese has started to look at countries that are hydrocarbon rich but gasoline or crude poor, compared to their domestic demand. Unsurprisingly we find the United States on the list, and also Australia, China, India and Indonesia.
So, where is Celanese heading to commercialize this US-developed technology? Why, China. As Celanese’s Mark Oberle points out, “China has the half the world’s demand for industrial ethanol and is growing fast on the fuel side – it’s a country that will have the largest energy demand complexes.” Why risk the dark waters of deploying highly-advanced technology in China, given the technology piracy and international partnership perils, instead of the comfortable home waters of Texas?
“It’s faster to work through the commercial discussions [elsewhere], than the US policy discussion,” said Oberle. “On the US side, there’s been a significant amount of interest in this economically viable, technology proven, ready now option. We continue to have discussions with folks across a broad spectrum of interests: those that have raw material, those in states that have high impact from corn for ethanol, those concerned about water supply. There, our technology can be a very legitimate part of an energy portfolio. But, outside the US, we have quickly moved from exploring the technology to substantive commercial discussion with multiple customers in multiple countries. In China, for example, not using a lot of arable land and water is important.”
The scale and cost of the Celanese technology? They can build a 350 million gallon (1.1 million tonne) facility for less than $600 million.
Initially, expect those investments and jobs to flow through China. Celanese is looking at building a 200,000 tonne unit in the Nanjing area by 2013, and is continuing to negotiate to have 1-2 greenfield units in China by 2014. The US will be home to a much smaller technology advancement facility in 2012 that will be based in Clear Lake, Texas, that will not have significant commercial volumes.
Let’s bring this back from Celanese to the policy front. $1.50 – $1.75 fuel ethanol, produced at 100-350 million gallons per manufacturing plant, and constructed at a capex of $1.75 per gallon, based on technology out of Texas. Certainly, not a complete substitution for the oil platform, or anywhere near it – but why not part of the US energy mix?
Two reasons. One, carbon policy, as natural gas-derived ethanol will not qualify under the US Renewable Fuel Standard. Two, market access. There’s not much room, under E10 blending caps, for more ethanol in the US. Already, domestically produced ethanol fuel is being exported in record amounts, even while crude oil is being imported in huge volumes – simply a function of the number of flex-fuel cars and pumps.
So – new technologies – sidelined by limits to market access. Given the kinds of money tossed around, say, on the Solyndra loan guarantee, the absence of action on flex-fuel vehicles is a scandal. At $100 per vehicle, 5 million new flex fuel vehicles could have been constructed for the price of the failed Solyndra loan. Using, say, E30, they could have represented 1.0 billion gallons of added renewable fuel demand, and generated $2.6 billion in domestic fuel demand – annually. Over 10 years, that’s $26 billion in money that stays at home. As opposed to money mailed to the you-know-whos in the you-know-wheres. And how much economic activity is stimulated, overall, by $26 billion? Economic planners usually use multiples in the neighborhood of 3 to 1. So, arguably, $78 billion over 10 years. Lot of jobs in there. Lot of money to fight the carbon problem. No wonder the Chinese are embracing technologies like Celanese. They know that, in order to fight a war on carbon, first you need to fill your war chest. Not someone else’s.
2.8. More on the food vs. fuel debate
This is a very heated and important subject. The initial outcomes of increased ethanol manufacture in the US has certainly provoked an uproar because coincident with it a set of circumstances arose that really made the price increase much higher than the simple fact of using the feed corn for ethanol. The world bank discussion below tries to untangle these other aspects. Clearly however, the future trending toward both cellulosic ethanol and the linking of ethanol production with cattle feeding can go a long way towards mitigating the problem.
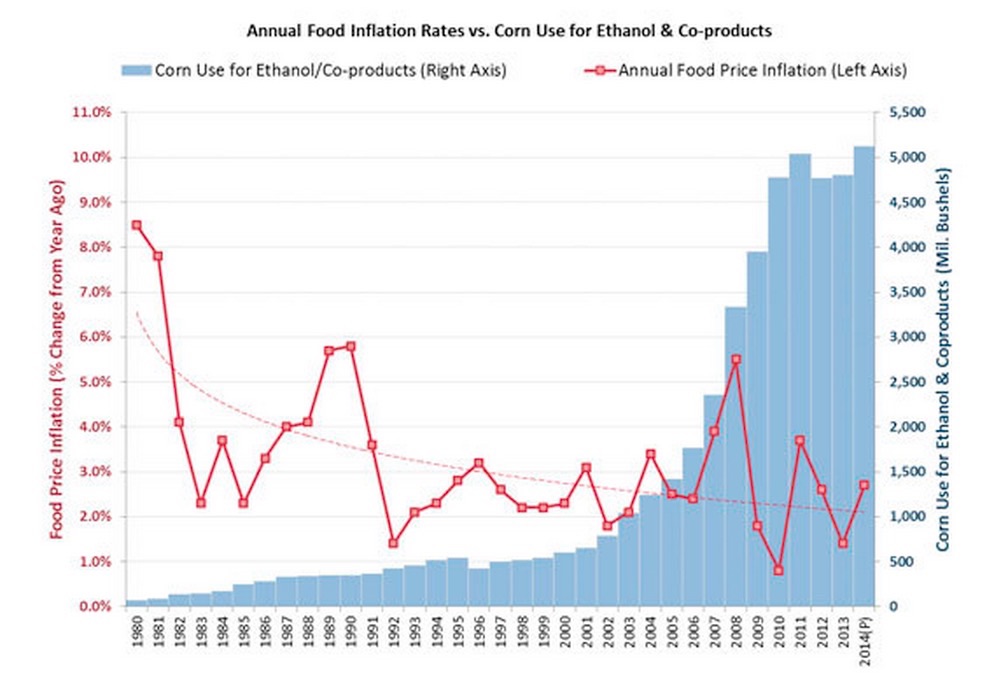
However, even before the onset of cellulosic ethanol commercial production, over the 35 year period from 1980 to 2014, plotted below, the Food Price Index has, on average, gone down as the corn use for ethanol & coproducts increased.
2.8.1. World Bank's Perspective on whether the increase in the cost of food is primarily related to ethanol production
One of the reassessments that has helped to put the situation into perspective is the World Bank's report Placing the 2006/2008 Commodity Price Boom into Perspective" 2010. Its authors conclude, "This paper concludes that a stronger link between energy and non energy commodity prices is likely to be the dominant influence on developments in commodity, and especially food, markets. Demand by emerging economies is unlikely to put additional pressure on the prices of food commodities. The paper also argues that the effect of biofuels on food prices has not been as large as originally thought, but that the use of commodities by financial investors (the so-called ”financialization of commodities”) may have been partly responsible for the 2007/08 spike." This is a reversal on their earlier pronouncement that biofuels had a 'pronounced' effect. The main piece of new information that influenced their change of thinking is that "The results imply that it is important not to analyze commodity markets in isolation from one another, because the impact of events that seemingly affect one market will eventually be equalized among most commodity sectors". Furthermore, they add "then high energy prices coupled with the high energy intensity of agricultural commodities imply that developments in non‐energy (especially food) markets will depend strongly on the nature and degree of the price links between energy and non‐energy commodities."
They show that energy prices explain a considerable part of commodity price variability; the adjusted R2 of all regressions averaged 0.85. Specifically, the parameter estimate of the non energy index (top row of Table 6) is 0.28, implying that a 10 percent increase in energy prices is associated with a 2.8 percent increase in non‐energy commodity prices, in the long run. The conclude the discussion on correlation of factors, saying, "A number of key conclusions emerge from these results. First, the prices of most commodities respond strongly to energy prices, with the response further strengthening in periods of high prices (the values of the estimated elasticities increase considerably when the recent boom is included in the analysis). More importantly, the difference between the last two estimates indicates that the effect of energy prices on the prices of all commodities has increased considerably when the recent boom is taken into consideration— suggesting that the energy/non‐energy price link has strengthened (see earlier discussion). Many observers have attributed such strengthening of the relationship to the use of biofuels, which also coincides (roughly) with the boom. Yet, it is important to note that the strengthening of the effect of energy on non‐energy prices is more pronounced in non‐food commodities (e.g. raw materials and metals) than in food. Thus, common factors appear to have played a more prominent role in the recent boom."
This more recent data tries to look at all the factors. They summarized the situation in the follow graphs.
There overall conclusions are:
"Numerous factors have contributed to the recent commodity boom, and have been analyzed extensively in the literature. Yet their relative weight continues to be an area of contention. In this paper we examined three key factors whose role has been somewhat controversial: speculation, the growth of demand for food commodities by emerging economies and the role of biofuels. We conjecture that index fund activity (one type of “speculative” activity among the many that the literature refers to) played a key role during the 2008 price spike. Biofuels played some role too, but much less than initially thought. And we find no evidence that alleged stronger demand by emerging economies had any effect on world prices. Although tentative, these conclusions provide insights into the determinants of the future path of commodity prices, which is still uncertain. Central among the uncertainties is the relationship between the prices of energy and of food commodities. Our examination of the key characteristics of longer‐term commodity price behavior revealed a strong link between energy and non‐energy prices, which increased considerably during the recent boom; it also revealed that co‐movement among the prices of food commodities is very strong. The latter implies that events taking place in one sector (e.g., increased demand for maize for the production of ethanol) will affect other markets (e.g., for wheat) through reallocation of resources, especially land. It also implies that policy changes in one market may affect other markets. For example, expectations about the use of corn for biofuels could result in high wheat prices even in the presence of record levels of wheat stocks. Our results also show that agricultural commodity market fundamentals appear, in the short term, to be playing somewhat less of a role than in the past, tending to be overshadowed by the much stronger pull of energy prices.
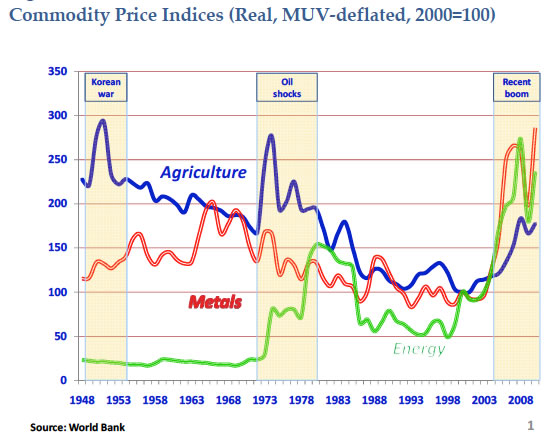
In the chart below from their paper it is interesting to note that for the most part the agriculture index has fallen from 1948 and risen slightly with the fast rise in energy. Thus, on the policy side, attempts to introduce mechanisms with price triggers (as has often been proposed recently) are likely to fail. In fact, the absence of trends (or simply put, the non‐existence of an “average price”) may be the key reason why earlier price stabilization (or other) mechanisms failed. When prices stay low for long periods, stabilization funds run out of resources, and when prices stay high for long periods, stabilization funds tend to be misused. Consider, for example, that the agricultural commodity price index (shown below) exceeded its period average (equal to 173) in all years during 1948‐71 and fell below it in all years during 1981‐2007.
 The recent boom took place in a period when most countries, especially developing ones, sustained strong economic growth. During 2003‐07, growth in developing countries averaged 6.9 percent, the highest five‐year average in recent history. Yet apart from broad and prolonged economic growth, the causes of the recent boom were numerous, including macro and long‐term as well as sector‐specific and short‐term factors.
Fiscal expansion in many countries and lax monetary policy created an environment that favored high commodity prices. The depreciation of the US dollar—the currency of choice for most international commodity transactions— strengthened demand (and limited supply) from non‐US$ commodity consumers (and producers). Other important contributing factors include low past investment, especially in extractive commodities; investment fund activity by financial institutions that chose to include commodities in their portfolios; and geopolitical concerns, especially in energy markets.
In the case of agricultural commodities, prices were affected by the combination of adverse weather conditions and the diversion of some food commodities to the production of biofuels (notably maize in the US and edible oils in Europe). That led to global stock‐to‐use ratios of several agricultural commodities down to levels not seen since the early 1970s, further accelerating the price increases (Figure below). Policy responses including export bans and prohibitive taxes that were introduced in 2008 to offset the impact of increasing world food prices contributed to creating the conditions for the “perfect storm.”
During the most recent decade, despite a clear acceleration of GDP growth since 2003, stronger demand for agricultural products both at world level and in China and India has been the exception—it occurred in maize and in soybeans (driven by demand for edible oils), and was rather mixed in grains, but certainly did not occur in meats or dairy products (see Table 2 with a breakdown of the 1997‐2008 period for the world, China, and India). Similar findings on the role (or, the non‐role) of China and India have been discussed in Alexandratos (2008: 673) who emphatically stated that “… their [China’s and India’s] combined average annual increment in consumption (both growth rates and absolute increments) was lowe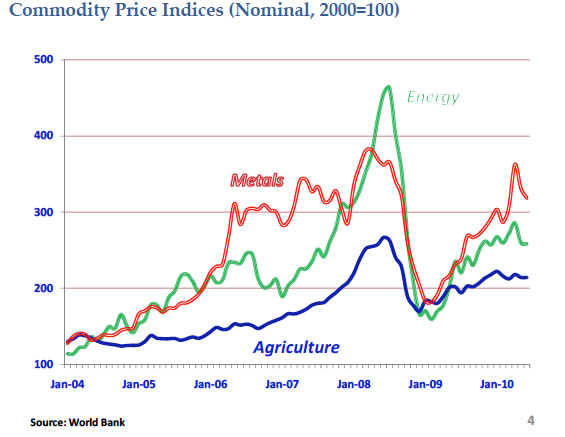 r in the years of the price surges, 2002‐08, than in the preceding period 1995‐2001.” FAO (2009) arrived at nearly identical conclusions.
These developments reflect the huge gap that existed during the price boom between the fundamentals of agricultural markets and the corresponding price levels. No other example demonstrates this better than the fact that the highest price increases took place in two commodities—wheat and rice—where food demand was stagnating and yet were widely explained as being driven by strong food demand.
The data clearly show that demand growth has slowed for most grains—including those used for feed, reflecting a slowdown in the growth of demand for meat.
The weakening and/or reversal of these factors, coupled with the financial crisis that erupted in September 2008 and the subsequent global economic downturn, induced sharp price declines across most commodity sectors. But though commodity prices have declined sharply since their mid‐2008 peak (see figure above), they picked up again recently and the key commodity price indices are still twice as high as their early 2000s levels.
2.9. References
John A. Mathews, Hao Tan, Michael J.B. Moore, Geoff Bell 2011 "A conceptual lignocellulosic ‘feed+fuel’ biorefinery and its application to the linked biofuel and cattle raising industries in Brazil", Energy Policy 39 (2011) 4932–4938.
Return to Ethanol Fuels Table of Contents
.